
How do you view your position in the world? Are you an active participant? A passive observer? Somewhere in between?
I’m not really sure where I fall. I do have a habit of jumping feet-first into new experiences, but I’ve also spent plenty of time simply observing the world around me. Most of the time, I’d prefer to get lost in a really good book and explore that world instead.
One of my fundamental beliefs about education is that curiosity is a powerful learning tool. The more I’ve been involved in academic research, the more I’ve realized that pretty much all research starts with one curious person. Wondering, dreaming, exploring—it makes us human. As a teacher, one of the reasons standardized testing so frustrated me was that it tended to take away those chances for curiosity and replace them with test prep.
This semester, I’m learning to be a better academic researcher. Well, actually, I’m learning to be a better qualitative researcher. But really, I’m learning to be an explorer of the world.
Throughout the next couple months, I’m going to be digging into How to Be an Explorer of the World by Keri Smith to “document and observe the world” around me. As a perpetual student, learning never stops for me, and I hope that, even once I finish a terminal degree, I can still continue to learn and improve myself. This project is an important way for me to continue growing and learning—and most importantly, to stay curious.
To anyone reading this post, I hope you’ll consider joining me as I learn to become an Explorer of the World.
Exploration #16: Survey
For my first exploration, I initially chose Exploration #12: Fifty Things, and I intended to travel to the Baytown Farmer’s Market to complete it.
Mother Nature had other plans. High winds and dropping temperatures closed the farmer’s market down just before we arrived, so I’ll save that one for next month’s farmer’s market or maybe another setting and move on to Plan B.
Lesson #1: Right now is not always the ideal time for a study. Sometimes it’s better to wait for the right time.
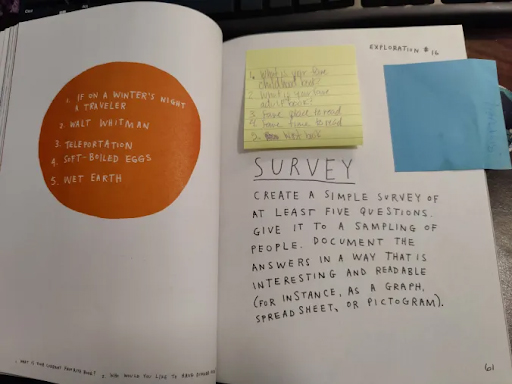
Exploration #16 has a couple of components, and it took me the weekend to complete. First, “create a simple survey of at least five questions” and “give it to a sampling of people.” Then, once I have responses, “document the answers in a way that is interesting and readable.”
I chose this exploration first for a couple of practical reasons. It didn’t require me to leave the house, an important consideration with the current weather. It’s simple enough to complete through social media. It’s familiar to me—I mean, who hasn’t seen those social media surveys or quizzes floating around (often looking to gain your private information, but that’s a topic for another day)? Plus, creating a cool visual to document the responses sounds like a great excuse to play with Canva, which is one of my favorite things to do!
I also chose this one because it gives me an opportunity to learn something new about people who I already know and about the world around me. That is the point of these exercises, right?
The Survey
For my survey, I chose to use books and reading as my topic. I’ve been obsessed with books since I learned to read, and I’ve been obsessed with writing since I learned to write, so it felt like an obvious topic.
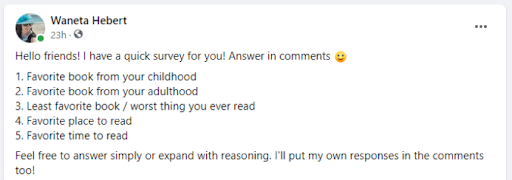
I chose five simple questions that I thought could spark some interesting responses. I opted for a more informal structure rather than writing them out as questions.
- Favorite book from your childhood
- Favorite book from your adulthood
- Least favorite book / worst thing you ever read
- Favorite place to read
- Favorite time to read
Lesson #2: Choose a research question that is interesting or that you care about.
Before the Results
When I first posted, there were a couple things I was curious about when it came to the responses I would get, aside from my desire to add new books to my Want to Read list on Goodreads.
First, I was curious about how much detail people would share. I wrote, “Feel free to answer simply or expand with reasoning.” I knew some would stick to just giving answers, and I wondered how many would want to provide descriptions or reasoning for their choices.
I was also curious about people’s ability to choose one favorite. I personally struggle with selecting one favorite book or one favorite time or place to read. I have shelves full of books I love and I can read anytime, anywhere. I know I’m not the only bibliophile in my group of friends and acquaintances, so I couldn’t wait to see how many responses listed more than one for each answer.
I wondered who from my friends list would respond to my survey. My family? My teacher friends? My college friends? Fellow graduate students and academics?
And finally, since I posted this survey as a Facebook post, I was curious to see if any conversations would spring from the responses. Would people comment and reply to each other? Would I see comments like “I loved that book too!” or “How could that be your least favorite? It’s great!” or “What is that book? Tell me more!”?
Lesson #3: Be curious about the results.
The Results
In the 24 hours following my original post, I had 12 survey responses on my Facebook post, plus two responses that I received via text message (not counting the “I don’t read” response that I also received via text message).
There was surprisingly almost zero interaction outside of responding to the prompt. Not counting my own engagement, only one response received a “like,” and one person posted that they had “come to steal the answers.”
To begin the second part of this Exploration, I copied and pasted all 13 responses into a Google Sheet, seen below.
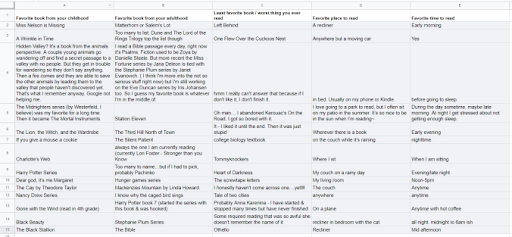
Exploration #16 uses the words “interesting and readable” to describe the visual documentation. This spreadsheet may be full of interesting data, but it’s not very interesting or readable on its own.
My initial intention was to create a separate visual for each question, summarizing the results with images of book covers and creative graphics. However, as I copied and pasted each response into the Google Sheet, I realized that the interesting part of the data wasn’t the actual responses—it was the intersections between responses.
Lesson #4: Sometimes the answers lie not in the data themselves, but in the intersections between the data.
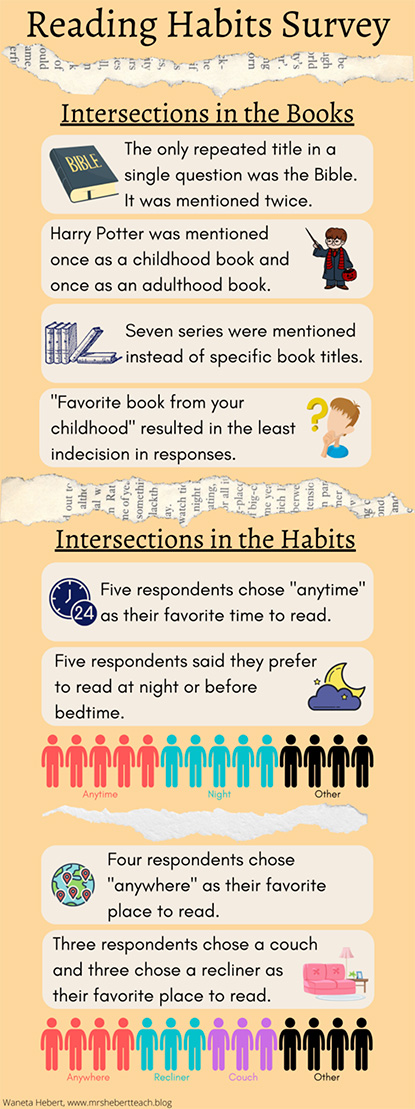
I started by creating a quick list of things that I noticed as I looked over the complete dataset. I looked for gut reactions, patterns, and surprising findings. Then I opened a blank canvas in Canva and started working on an infographic to summarize the key findings.
As I always do in designing, I allowed the data to drive the form, inserting graphics as necessary to aid in conveying the message. I chose the light orange background color in honor of the book itself, which is printed in black-and-white with orange accents. I chose images of ripped book pages for section dividers to keep with the bookish theme. I used pictograms where appropriate to further visualize the data. As I created the key points, I adjusted the organization several times until the takeaways were grouped meaningfully.
I probably spent far too long on this part of the exercise, but I’m quite pleased with the end result.
There were several things that surprised me about the results that I received. I expected to see more overlap in responses, where there was actually very little. I also expected there to be more conversation in the comments about books, but again, there was actually very little.
I believe this is a good thing. It’s great to have your suspicions or beliefs confirmed, but the more interesting phenomena are the ones that are unexpected.
Lesson #5: Let the data surprise you.
Reflection
This was a fun activity to start my exploration journey for this semester. I believe it taught me to look at data a little differently, looking for patterns and intersections between responses rather than at the individual answers.
It also emphasized a trait that I believe I’ve always had: flexibility. As a teacher, it’s common to see that a lesson is not going to plan and make adjustments to improve the learning experience for students. I’ve always had an innate ability to identify when I need to change something and when I need to stick with it and let the lesson play out. I changed course with this activity a couple times, the first time being in my simple choice of exploration to complete. I also considered posting the survey to Facebook and Twitter to compare responses, but decided that I likely wouldn’t get any different people on Twitter than were already on Facebook. I revised the wording of the first two questions to avoid saying “adult book” as I was afraid that could be misinterpreted. I adjusted my entire plan of action in creating the visual, allowing the data to redirect me several times. Flexibility is an important trait in a teacher, and I can see that it is also an important trait in a researcher.
Throughout the experience, I discovered little qualitative researcher lessons along the way, and they’re sprinkled through this post. Here they are again:
- Lesson #1: Right now is not always the ideal time for a study. Sometimes it’s better to wait for the right time.
- Lesson #2: Choose a research question that is interesting or that you care about.
- Lesson #3: Be curious about the results.
- Lesson #4: Sometimes the answers lie not in the data themselves, but in the intersections between the data.
- Lesson #5: Let the data surprise you.
I’m not quite sure yet how this experience has changed the way that I interact with the world. This is just step one in my journey to be an explorer of the world. I can’t wait to see where this path takes me next.
Each of the lessons I learned through this exploration can be put into practice with Credo Reference, starting with Lesson #2 (choose a research question). What is a topic that piques your interest? Let that curiosity fuel your own exploration through the Credo Reference database results. Remember that each result may contain an answer, but sometimes the true answer lies in the intersections between results. It’s far too easy to go into a search with preconceived expectations of what you’ll find. When you open the database, open your mind to the possibilities of what you may learn, and always let the results surprise you.
Don’t think I’ve forgotten about that first lesson! Sometimes now isn’t the right time. When we allow ourselves to freely explore, we tend to fall down rabbit holes of information. But, with more than 11,000 topics, you may not be able to explore every one of them right now. Trust me, every researcher has a folder of potential future topics. All research starts with one curious person.
Learn more about Credo Reference for colleges and universities and public libraries, and take a FREE TRIAL today!
Originally published on Mrs. Hebert’s Classroom on January 16, 2022. You can also listen to the podcast here:
Like this article? Check out the next blog articles in this series:
- Exploring the World in Words
- Exploring Pointillism in My Backyard
- Exploring the Farmers Market
- Exploring Beyond My Comfort Zone
- The Sounds of Exploration
- Exploring the Past (Without Time Travel)
- Exploring a World of Magic
See also: